Summary
We illustrate the random field theory of connectivity [1] with two applications: connectivity between MS lesion density and cortical thickness; and connectivity between fMRI data and pixels in a picture of a face masked by ‘bubbles’. In both examples, we correct for searching over all correlations between a volume and a surface.
MS lesions
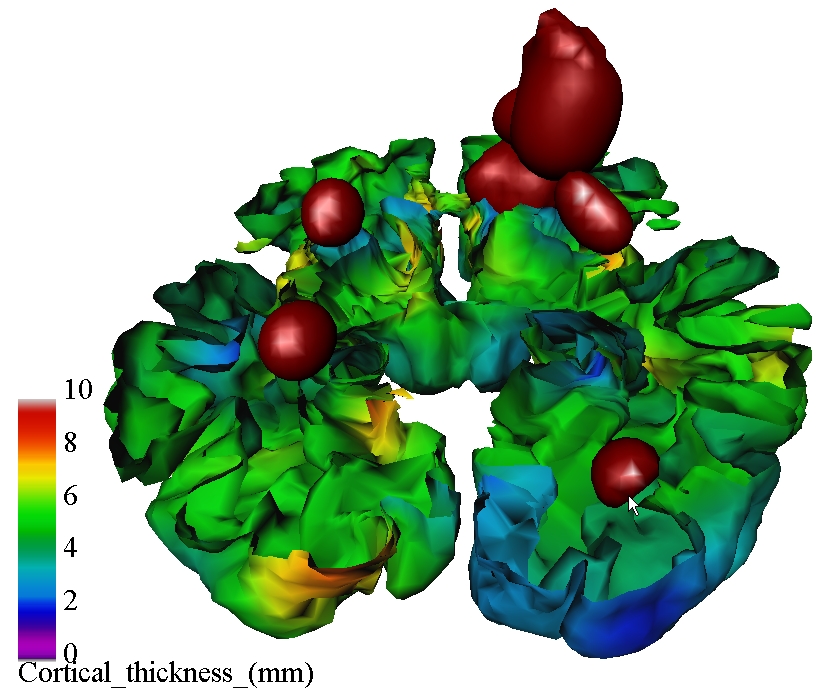
We hypothesise that a lesion in white matter interrupts neuronal signals to ‘down-stream’ grey matter to which it is connected, causing cortical thinning. Data on one subject in the figure below (posterior view, cortex cropped at z=0), showing lesion density >5%, suggests that the thinner cortex in the right (~2mm) compared to left (~6mm) visual area might be caused by the presence of an adjacent MS lesion (red, arrowed).
N=425 subjects with mild MS were scanned with MRI [2]. Lesions were segmented and smoothed 10mm. Cortical thickness was determined on a common triangular mesh, then smoothed 20mm. The search regions were all brain voxels with lesion density >1% (37,263 2mm voxels, resels=166.4) , and the entire cortical surface (40,962 nodes, resels=457.1) [3]. To correct for searching over (negative) correlations between all pairs of brain voxels and surface nodes (removing linear age and gender effects), the P=0.05 threshold was c=0.291 (T=6.25, df=421). Only 5D local maxima above threshold were retained, leaving 25,236 local maximum correlations significant at P=0.05. The top 278 above c=0.500 are shown below as arrows joining voxels in the brain to nodes on the surface, colour coded by correlation.
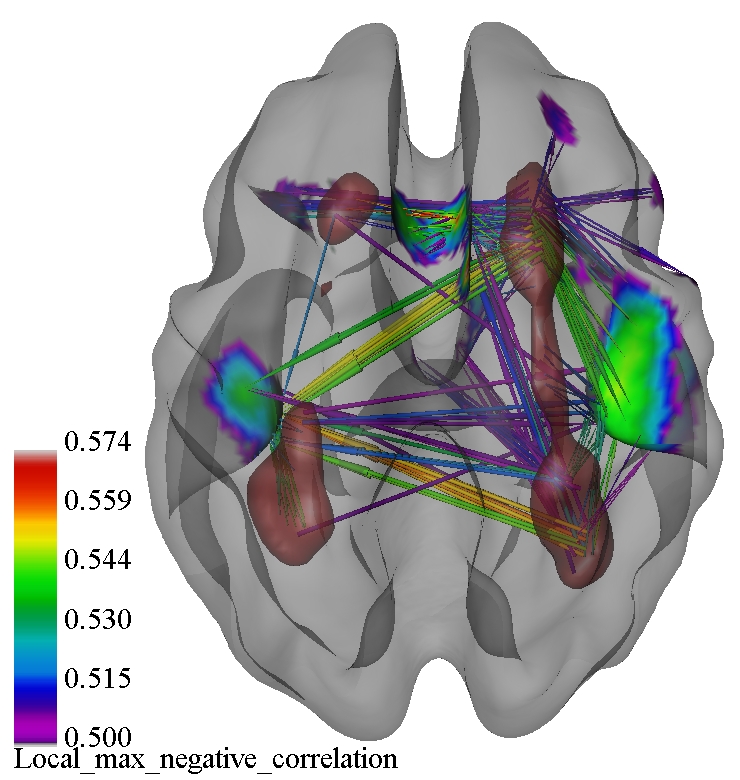
The connectivites are similar to those reported in [2]. Note the connectivity between opposite hemispheres, perhaps due to brain symmetry.
Bubbles task
In a classic bubbles task, a subject is shown a picture of a face that is partially revealed through a mask of randomly centred Gaussian ‘bubbles’, then asked to discriminate between a happy, sad, fearful or neutral face, repeated over 3000 trials [4].
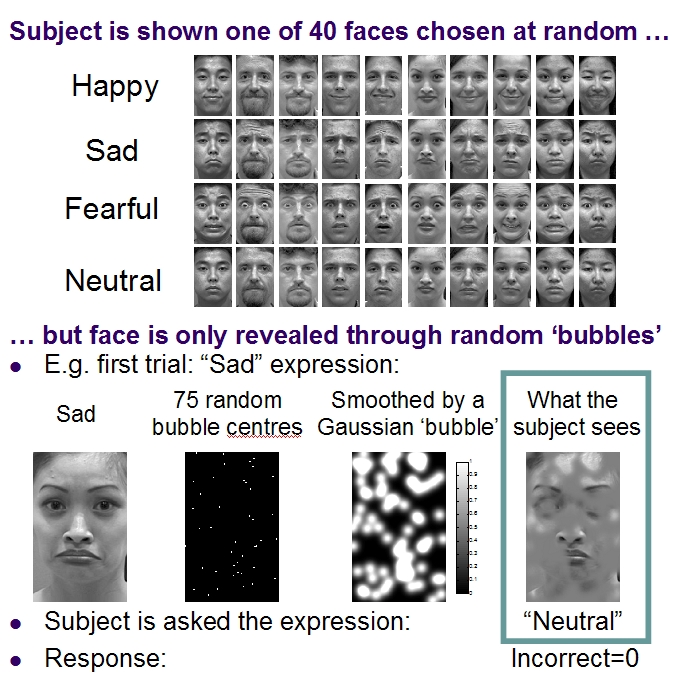
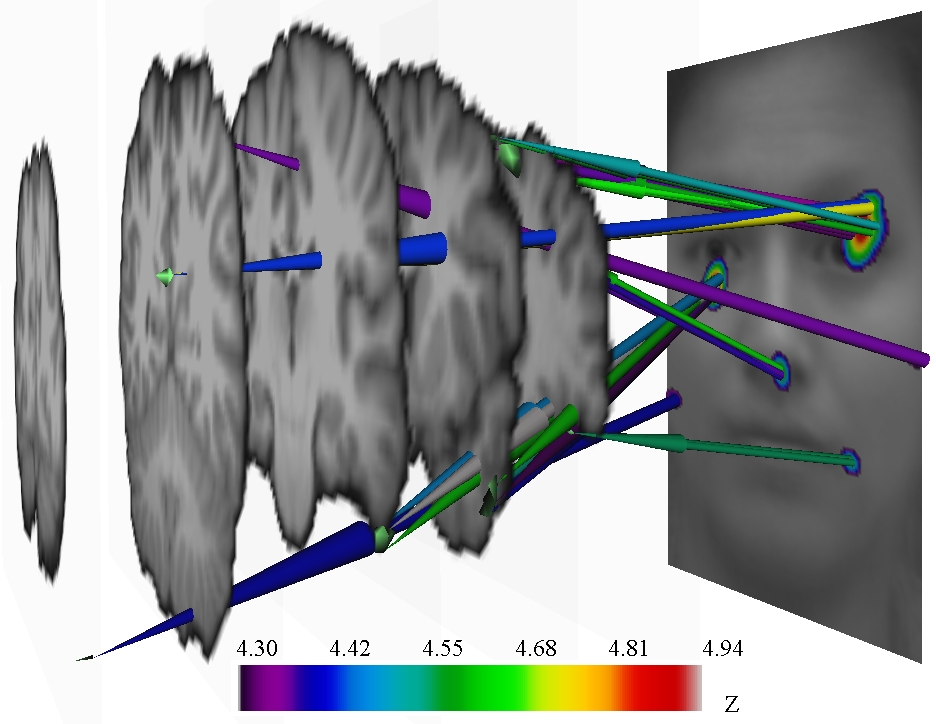
The values of the bubble mask at each pixel are correlated with the responses (1=correct, 0=incorrect) to reveal those pixels which are used to make a correct response. In a pilot experiment, fMRI data was collected on one subject while performing the bubbles task just described (30 runs, 200 TR=3s frames per run, 100 6s trials per run) [5]. We replaced the binary response by fMRI data at each voxel, then correlated this with bubble masks at all pixels, to obtain correlations between all pairs of voxels and bubble mask pixels. Again the above analysis was used to obtain a correlation threshold corrected for searching over all within-brain voxels (35,681 4mm voxels, FWHM=8mm, resels=4,454) and all image pixels (120 x 190 pixels,resels=146.2). The resulting threshold was Z=6.22 (df~Inf). Unfortunately no correlations reached statistical significance on this pilot data. Correlations with Z>4.3 shown below (subject is facing picture) suggest that the picture's left eye activates the subject's right fusiform face area (Z=4.94).
References
[1] Worsley etal.(2004). NeuroImage,23:S189-195.
[2] Charil etal.(2007). NeuroImage,34:509-517.
[3] Worsley etal.(1999). Human Brain Mapping,8:98-101.
[4] Gosselin, Schyns (2001). Vision Research,41:2261-2271.
[5] Garrod, Smith etal.(2007). OHBM poster/abstract #56.