Figure 1: EC density for Roy's maximum root SPM
Keith J. Worsley1, Jonathan E. Taylor2, Francesco Tomaiuolo,3
1Department of Mathematics and
Statistics, and Montreal Neurological Institute, McGill
University, Montreal, Canada,
2Department of
Statistics, Stanford University,
3IRCCS Fondazione 'Santa Lucia', Roma, Italy
This abstract fills a gap in the random field theory for the P-value of local maxima of SPMs from multivariate linear models. So far results are only available for:
- univariate images, single contrasts (T SPM, [1]),
- univariate images, multiple contrasts (F SPM, [1]),
- multivariate images, single contrasts (Hotelling's T2 SPM, [2)].
We report results for
- multivariate images, multiple contrasts.
Examples of multivariate image data are: vector deformations to warp an MRI image to an atlas standard, diffusion tensors, and the HRF sampled at 1s intervals. Examples of multiple contrasts are: several polynomial effects, several performance measures, or differences between several groups.
For multivariate data and multiple contrasts, there are several different test statistics, all based on the eigen values r of W-1B, where W is the error mean sum of squares matrix, and B is the regression mean sum of squares matrix. The natural choice is the likelihood ratio test Wilks' L, equivalent to the product of 1/(1+r), but the random field theory for this has so far proved intractable. However we have succeeded for an alternative, Roy's maximum root R=max r, reported here.
A simpler definition of Roy’s maximum root is the following. Take a linear combination of the multivariate image data, creating univariate image data. Work out the F SPM for relating the univariate image data to the multiple contrasts. Roy’s maximum root R is the maximum F SPM over all such linear combinations.
The maximum canonical correlation C can be defined analogously as the maximum univariate correlation between all linear combinations of the multivariate data and multiple covariates. The relation between the two is R=(C/b)/((1-C)/w), where b and w are the degrees of freedom of B and W. Applications are effective connectivity, detected by the maximum canonical correlation between multivariate image data at a single reference voxel, and that at all other voxels. If the reference voxel is varied as well, the search space is 6D rather than 3D, and the results of [3] have been extended in the same way.
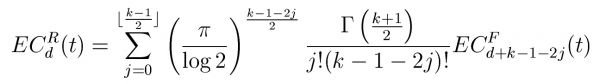
The P-value of local maxima of a smooth SPM in D dimensions is well approximated by
where Reselsd and ECd(t) are the resels and Euler characteristic density in d dimensions. Figure 1 gives a surprisingly simple expression for the EC density ECdR(t) of Roy’s maximum root for k components in terms of the EC density ECdF(t) of the F statistic with b,w df [1]. The EC density of Hotelling’s T2 [2] now falls out as a special case when b=1.
Figure 1: EC density for Roy's maximum root SPM
These results are available in FMRISTAT (www.math.mcgill.ca/keith/fmristat/toolbox/stat_threshold.m) and applied to detecting regions of brain damage of n=17 non-missile brain trauma patients compared to n=19 age and sex matched controls, using vector deformations images, and correlating the deformations with 6 memory tests.
[1]. Worsley et al. (1996). Human Brain Mapping, 4:58-73
[2]. Cao, Worsley (1999). Annals of Statistics, 27:925-942.
[3]. Cao, Worsley (1999). Annals of Applied Probability, 9:1021-1057.